Reports
To view reports, log in to your advertiser dashboard and go to the ‘Reports’ column. Click on the report you want to see.
Credits Usage allows you to see how many credits you used within a given period of time (billing cycle, or a specified range of dates). Specify what billing cycle or range of dates you would like to view credit usage and the credits will come up according to what action the credits were used towards, a description of the action, and how many credits were used.
Click on the action itself to see a more detailed credit usage report:
Here, you can see the mobile numbers the action applied to, what time and date the credits were applied, and how many credits applied to each number.
Next, Send a coupon allows you to see when coupons got delivered, coupon id #, what opt-in lists the coupons were sent to, mobile numbers that were added, total numbers and the preview of the message that was sent.
When you click the total numbers, you will be shown a table with the numbers it was sent to, the sent status, if there was an error message, and lastly there will be a preview of the coupon.
Messaging Delivery is the same as Coupon Delivery, except instead of coupons it deals with sent messages.
Landing Pages View is the next report:
Pages View allows you to see how many times a mobile web page was viewed. The table includes the name of the mobile page, the keyword associated with it, the date it was created, its beginning and end date, and total times it was viewed. If you click the total views, you will be shown the phone numbers that viewed the page (if applicable), and what time and date the page was viewed.
Hit Auto Response allow you to view results for your polling and questionnaire campaigns:
Above, you can see the question and the total number of responses.

If you click the total numbers, you can see number of responses for each response and how many numbers did not respond.

If you click the total numbers for each response, you can see what mobile numbers gave that particular response as well as the date and time they responded.
"Select opt-in welcome" to view messages sent to opted in customers
If you click each list, you can see a list of numbers, how and when they opted in and/or out:
You can also see the number of people who opted out in the "Opt-out"section
Clicking opt-in/opt-out will show you who opted in and out of your list
Total Coupons Usage allows you to view different coupons according to whether they were sent (Clip), viewed (View), redeemed (Redeem), or removed (Remove) from the coupon wallet.
When you click the numbers under ‘Clip’, the report will show you just how the coupon got sent and to how many numbers for each method:
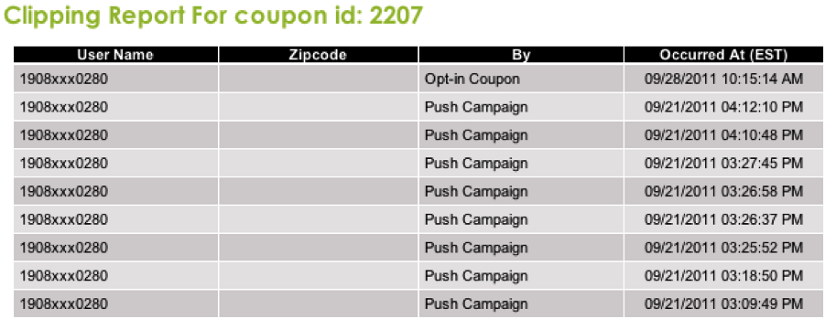
As you can see above, the coupon got sent 1 time by opting in to a list, and 8 times by a push campaign, which is when a coupon gets sent to an opt-in list.

Click the total number and you will see the phone number, zip code of the number if you have it, by what method was the coupon sent, and what time and date it was sent to the number.
Coupon Usage Wizard allows you to generate a report on the coupon of your choosing.
First, select what action you want to generate the report for. Select ‘Redeem’ to see redemption for coupons, ‘View’ to see how many times certain coupons were viewed, ‘Clip’ to see how many times coupons were sent, ‘Remove’ to see how many times certain coupon was removed, and ‘All’ if you want to view all actions.
If you click the total numbers, you can see number of responses for each response and how many numbers did not respond. Filter coupons by whether they are active or have expired, display the coupons by their name or by their ID#, you can add individual coupons or add all. You can also remove coupons accordingly. Select the coupons and press the ‘Add’ button. You will see a preview for each coupon you select to the right of this menu. Next, select the range of dates you want to generate the report for.
When you are ready to view your report, hit ‘Generate’. The report that is generated is the same format as the total coupons usage report:

0 Comments